Six Things the Traditional Agency Staffing Model Can Cost You
- ATS Collateral
- Blog
What the Staffing Model Leaves Out.What Asymmetric Talent Builds In.
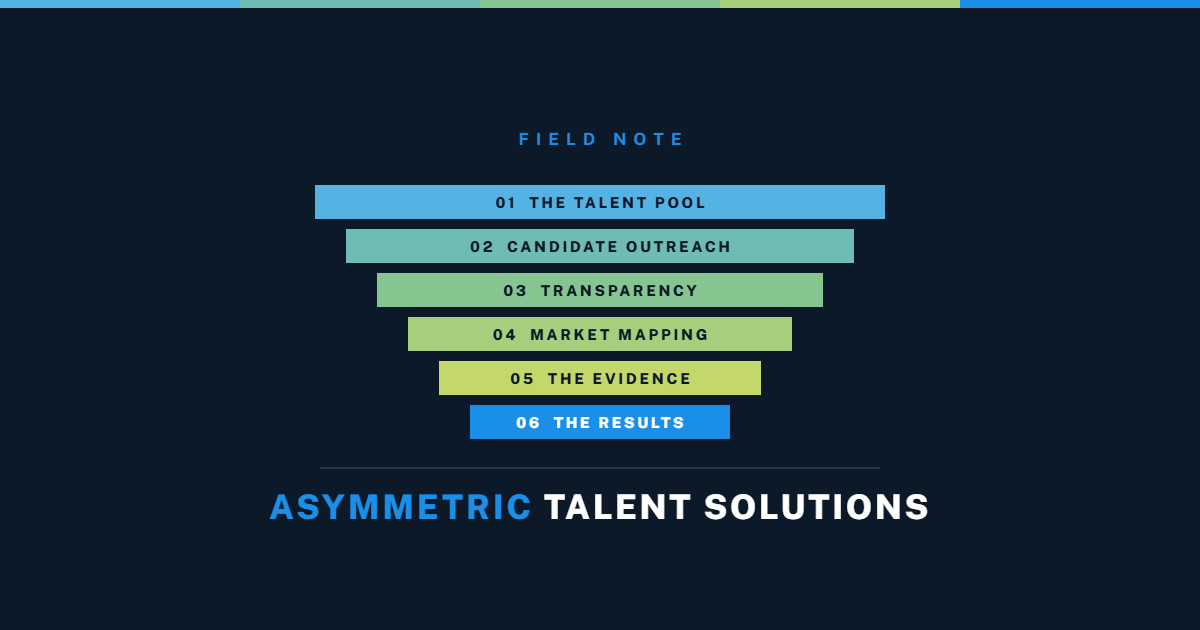
Every search looks the same going in. A handoff, a shortlist, a hire. Two firms can run the same seat, quote the same fee, and hand you the same number of names, and one of them will have shown you the market while the other showed you a corner of it and called it a market. The difference is everything you cannot see. This is a field note on the six places the traditional model quietly charges you, and what the same six look like when the search is run on evidence instead of instinct.
Four numbers that decide whether a search was run or merely staffed.
The traditional model is not bad at searching. It is bad at proving anything.
Nobody sets out to run a weak search. The traditional model fails for a structural reason, not a moral one: none of its costs are visible at the moment you incur them. You do not see the candidate who never got contacted. You do not see the size of the pool the five names came out of. You do not see the search that got quietly deprioritized when a warmer requisition landed on the same desk. Every one of those is a real cost, and every one of them arrives disguised as nothing happening.
A bad hire runs 30 to 200 percent of salary according to the U.S. Department of Labor and SHRM, and Leadership IQ puts new hire failure at 46 percent within eighteen months. Those are the numbers people quote. They describe the wreckage, not the mechanism. The mechanism is upstream, and it is simple: the model cannot tell you what it did not do.
The sample is invisible
Active job seekers are a slice of the market, not the market. When a firm sources from who is looking plus who they already know, the sample is defined by convenience. The best person for the seat is usually employed, is not looking, and will never see the posting. You are not choosing from the market. You are choosing from the part of it that raised its hand.
There is nothing to audit
Without a map, a shortlist cannot be evaluated. Five names with no denominator is not evidence, it is an assertion. You cannot tell whether the firm found the best five of six hundred or the only five who answered the phone, and neither can they, because the number that would settle it was never built.
Nobody owns the finish
A model with no commencement fee also carries no obligation to complete. When a search gets hard, and the searches worth running are the hard ones, the rational move for the vendor is to reallocate effort to an easier seat. Adding a second and third firm makes it worse, not better. Now everyone is racing, nobody is mapping, and your best targets get burned by three recruiters in the same week.
The line that separates the two models
Traditional recruiting is a leap of faith. We are a paper trail. Everything below is the same six decision points, run once on hope and once on evidence. Read them against the last search you authorized and see which column it was in.
The Talent Pool
Everything downstream is decided here. Define the market as everyone who is looking and you have already capped the ceiling of the search before a single conversation happens. Define it as everyone who could do the job and the ceiling is the market itself.
You pick from people who are job hunting
The pool is whoever is active: applicants, board responses, a database of people who once said yes to something. The best person for your seat is happy where they are. They are not on a job board, they are not answering ads, and they will never see your opening. So you never meet them. Not because they said no. Because they were never asked.
We find everyone who could do the job
Not just the ones looking. ~600 people per search, every one matched to your exact role. You down-select from the best of the best: qualified, interested, and assessed by us. Five times the qualified talent. The candidate who was never going to see a posting is the one we were built to reach.
Candidate Outreach
Building a list is not running a search. A list is a document. Reach is what happens when someone actually works it, tracks who was contacted, tracks who answered, and treats the answers as intelligence rather than as a yes or no gate.
Names get pulled. A few get messaged. Nobody tracks who
Most firms build a list and work the top of it until something sticks. There is no record of who was contacted, no record of who opened, and no record of who declined or why. The person you most wanted may never have heard from anyone. You will never know, because the tracking that would tell you was never turned on.
We reach the market and the market answers
We consistently reach 60 to 70 percent of the market, and replies come back at three times the normal rate. Every reply is live market intelligence: who fits, who wants it, what the seat actually pays, what would have to be true for someone to move. That feedback comes straight from your ideal talent and it steers the search in ways no research can.
Transparency
Status calls are how firms hide. A weekly call is a filtered summary delivered by the party with the strongest incentive to sound busy. It is not an audit, and it is not designed to be one.
You hand it to a vendor and hope
You wrote the job description before you knew what the market would bear, and nothing in the process ever tells you the market disagreed. Updates arrive by email, by text, and on calls, scattered across three channels and four people. Your team has four different versions of where the search stands. You are left guessing, and guessing feels like managing.
You have full access to the client portal
One source of truth for stakeholders. No scattered emails, texts, or calls. Every profile in the search carries a live status. We stay ahead of the market, with intelligent backup plans agreed at intake, so any shift is a move you already approved. No downtime, no lost confidence. You steer the whole search in under four hours. Most recruiters disappear into the process. We invite you into it.
Market Mapping
This is the single most useful question a buyer can ask a search firm, and almost nobody asks it: five out of how many? A shortlist without a denominator cannot be graded. Five out of six hundred is a fact. Five out of nothing is a hope.
You get five names and no denominator
Nobody built a map, so nobody can show you that you saw the whole market. You could be picking from one corner of it and never know. The shortlist looks identical either way, which is exactly the problem. The document that would have settled the question was never produced, so the question never gets asked.
We map the whole market and hand you the map
We map the entire market: comprehensive coverage from your ideal profile down to the minimum you would accept, open in your portal. That map is your proof you saw the real market, not a slice, and it is the biggest piece of evidence in the search. It is also the one artifact in the engagement that outlives the hire: the seat gets filled once, the map keeps working the next time you need to know who is out there.
The Evidence
A resume tells you where someone has been. An interview tells you how they present. Neither one tells you how they think, and the gap between presenting well and performing well is where most failed hires live.
A resume and a good conversation is the whole case
The interview tested talking. The job does not. At day ninety you find out the finalist interviews beautifully and cannot do the work, and by then the cost is not the fee, it is two quarters of a function running at half speed. Nobody can tell you who else was considered or why they were passed over, because that reasoning was never written down.
Every finalist reaches you as a built case
Not a resume: their experience, their DNA and fit, what it takes for them to move, and our recommendation, with a standardized video for fair panel review. Your long list carries that same evidence on every name, validated by data and behavioral science. We do not pitch candidates. We build cases. You interview and decide on proof, not a feeling.
The Results
The economics of the contingent model are not a secret and they are not irrational. They are simply not aligned with you. A firm paid only on placement optimizes for speed to any placement, not for the right one, and abandons the searches where that math stops working.
No commencement fee, and no one owes you a finish
Nothing is payable and nothing is promised. When the search gets hard the vendor moves to an easier one, and you find out through silence. The instinct is to hire a second firm and a third. That makes it worse. Now three firms are racing each other through the same names, your best targets get contacted three times in a week by people who cannot answer basic questions about the role, and your employer brand pays for it.
We finish every search we commit to
100% completion on every committed search, since inception, no exceptions. You pay in steps as the work is delivered, on milestones rather than timelines. One firm, one map, one accountable result, start to hire. The commitment runs in both directions, which is the only arrangement under which a hard search actually gets finished.
The six are not six problems. They are one problem, compounding.
Read the six points in order and the causality is obvious. Each failure is the input to the next. Fix the first and the other five become tractable. Skip the first and no amount of effort downstream recovers it.
The pool decision sets the ceiling
Define the market as active job seekers and every downstream number is capped by that choice. Outreach cannot exceed the pool you defined. A firm that reaches one hundred percent of a convenience sample has still reached a fraction of the market. This is why penetration only means something when it is measured against a mapped denominator, and why a reach percentage quoted without a pool size is a number with no unit attached.
The map is what makes transparency possible
Transparency is not a communication style, it is an artifact problem. A firm cannot show you a search it did not document. The reason status calls exist is that there is nothing else to show. Build the map first and the portal is simply the map with live statuses attached, which is why the audit costs you time you were going to spend anyway rather than time added on top.
Evidence and accountability are the same commitment
A firm that documents every finalist and logs every pass has made itself auditable, and a firm that has made itself auditable cannot quietly abandon a search. The case file and the completion rate come from the same decision. That is why the model that produces one reliably produces the other, and why the model that produces neither cannot be fixed by trying harder.
Take the six points with you
The full comparison on one page, built to hand to a hiring team or hold up against a proposal you are already reviewing. No form, no gate.
Where the two models separate, in numbers.
Four paired measures. The blue and green bars are ATS performance drawn from completed engagements. The black bars are the comparison figures, each labelled with its own source on its own row. Higher is better on all four. Bars are scaled within each pair.
Read the penetration pair twice
It is the only pair on the chart that is understated. Both figures are percentages of an addressable market, but only one of the two firms built one. Ours is a percentage of a mapped pool that averages ~600. Theirs is a percentage of whatever list happened to be reachable that week, and the size of that list is never stated. The chart compares the rates. It cannot show you the difference in what the rates are a percentage of.
The no is worth more than the yes, if somebody writes it down.
| Package and compensation | Comp signal |
| Timing off, happy, committed | Pipeline signal |
| Work requirements, location, onsite, relocation | Model signal |
| Turned off by industry or employer | Brand signal |
| Withdrew candidacy mid-process | Process signal |
| Disqualified by ATS or by the client | Calibration signal |
| General not interested | Baseline |
Most searches throw away their most valuable output. Every candidate who declines is telling you something specific about your seat, and in the traditional model that information evaporates the moment the call ends. Nobody logs it, so nobody can aggregate it, so the pattern that was sitting in plain view across forty conversations never surfaces.
ATS tracks every candidate who leaves the process against a reason. Individually the reasons are anecdotes. In volume they are a diagnosis. Thirty declines clustered on compensation is not thirty rejections, it is your comp band being wrong, discovered in week two instead of after a failed offer in week nine. Declines clustered on work requirements say your operating model is the constraint, not your pay. Declines clustered on the employer say you have a brand problem in this talent segment that no amount of sourcing volume will out-run.
This is what it means to say every reply is data. The search does not just produce a hire. It produces a read on how your seat, your comp, your model, and your name land with exactly the people you were trying to hire. That read is free, it is primary, and almost nobody collects it.
Front-load the work and the calendar takes care of itself.
The traditional model starts sourcing on day one and spends the next several months discovering the brief was wrong. ATS spends the front of the engagement building the intelligence the client does not own, then runs a search that does not need to be restarted. Finalists land in three to four weeks, not three to four months.
Intake and Discovery
Full stakeholder interviews. Role architected, behavioral benchmark set, comp strategy framed before anyone is contacted.
Build the Map
The full addressable market mapped against the brief. Named company targets, off-limits list, and the whole board for the role.
Engage the Market
Multichannel outreach across the pool. Live status on every profile. Comp and decline intelligence captured as it comes in.
Longlist and Case Files
Fully screened talent presented with complete case files and uniform video. You downselect from the longlist in the portal.
Shortlist to Close
Client interviews, finalists, offer, close. Search intelligence report delivered as the receipt on the completed engagement.
Performance against the standard, not against the average.
ATS figures are firm-wide averages drawn from completed engagements. Each industry figure carries its own source in its own cell.
| Metric | Asymmetric Talent | Industry |
|---|---|---|
| Search Completion Rate | 100% on every committed search | 15 to 20% contingent fill rate per AESC and SHRM |
| Market Penetration Rate | 60 to 70% | 15 to 20% per AESC and SHRM |
| Time to Finalists | 3 to 4 weeks | 8 to 16 weeks per AESC and SHRM |
| Client Hours Invested | Under 4 hours | 15 to 25+ hours per AESC and SHRM |
| Outreach Open Rate | 60%+ | 15 to 25% per AESC and SHRM |
| Qualified Talent Delivered | 5x more | Baseline, ATS internal reference point |
Cost of a bad hire runs 30 to 200 percent of salary per the U.S. Department of Labor and SHRM, with 46 percent of new hires failing inside eighteen months per Leadership IQ. Every row above is a lever on that number.
A completed search leaves behind a documented, qualified map of the market for that seat, with every out-of-process reason attached. The next time you open a role in that function you are not starting at zero, you are starting from a map with a known denominator and a live read on what the market wants. The hire is the deliverable. The map is the asset.
Which one of these six has already cost you something?
Not a rhetorical question. Run it against your last three searches. Do you know how many qualified people existed for the seat? Do you know how many were contacted, and by whom, and what they said? Can you name why each finalist was chosen over the ones who were not? Did every search you authorized actually finish?
If the answer to any of those is no, the cost was already paid. It just never appeared on an invoice. That is the whole argument. The traditional model is not cheaper, it is less itemized, and the line items it omits are the ones that decide whether the hire works.
Proven across 1,000+ searches by the team that built it.
Everybody promises the right hire. We prove it before you make one. The one-page version of all six points is here as a PDF, if you want something to put in front of the people who sign off on the search.
ATS figures drawn from completed engagements.
Stop authorizing searches you cannot audit.
If any of the six landed, the next search is the place to fix it. Bring us the seat that has been open too long, the one you cannot afford to get wrong, or the one you have never hired before. Three ways to begin.