Your Search Firm Can Show You Candidates. It Cannot Show You the Complete Market.
- Blog

Your Search Firm Can Show You Candidates. It Cannot Show You the Market.
Two things fill most shortlists. The active market, meaning people already looking and already sitting in the databases everyone pulls from. And the recruiter’s own network, which is real and worth something, but is a fixed set of people they happen to know. Neither one reliably reaches the person who would be ideal for the role and is not looking. This field note explains why that gap exists, what it costs, and what it takes to close it. It is a methodology piece, not a single engagement. The ATS figures are firm-wide averages across completed retained searches.
The map is built before anyone is contacted. Then the whole map gets worked.
The shortlist is real. The market behind it was never built.
You will often get the story about how they placed someone just like this before. That is a fair sign they know the space. It is not evidence the candidate in front of you is the best available. It is the best of what a rolodex and a quick sweep had on hand.
There was never a way to know how that measures against the full range of people who could do the job, from the ideal profile down to the minimum viable acceptable criteria, because that range was never built. Nobody drew the boundary. Nobody counted what sat inside it. The pool was not selected. It accumulated.
Ask a firm what the boundaries of the market for your role are and watch what happens. They will describe candidates. They cannot describe the market, because to them the market is not a thing that exists. It is whoever turned up.
The Cost
The market you never saw. You are choosing from a slice and calling it the field.
A list is not a search.
Three sources. None of them is the market.
The failure is structural, not personal. Plenty of good recruiters finish, and finish often. But the three inputs that feed a conventional shortlist share one property: every one of them is defined by convenience of reach rather than by the boundaries of the role.
The Active Market
People already looking, already applying, already sitting in the same databases every firm pulls from. They are reachable because they raised a hand. That is the only thing the group has in common. It is an availability filter, not a quality filter, and it selects hardest against the people currently doing the job well.
The Network
Real, earned, and worth something. Also fixed. A network is the set of people one recruiter happens to know, bounded by their career, their geography, and their prior searches. It does not expand to fit your role. Your role gets fitted to it.
The Prior Placement
The proof point that sounds like coverage and is not. Having placed a similar seat before demonstrates familiarity with the space. It says nothing about who was available for your seat, in your market, at this moment, under your constraints.
Industry data from AESC and SHRM puts contingent pool reach at 15 to 20 percent. That figure is not a measure of effort. It is a measure of how much of a market a convenience-sourced process can physically touch. The other side of it is not a rounding error. It is most of the people who could do the job.
We architect the total addressable market for the seat before we talk to anyone.
Every company that could hold this person. Every adjacent title that performs the work under a different name. The full range from the ideal profile down to the minimum viable acceptable criteria, drawn to the actual boundaries of the role rather than the boundaries of who is convenient to reach.
Every committed search gets that map. They average ~600 profiles. The deliverable from that phase is not a candidate. It is the boundary, drawn and counted, before a single message goes out.
Define the Seat, Not the Job Description
Structured discovery establishes what the work actually requires, what the market will pay, what is non-negotiable, and where the floor sits. The minimum viable acceptable criteria is set here, in writing, with the client. Without a documented floor there is no boundary, and without a boundary there is no market to map.
Draw the Company Boundary
Every organization that could plausibly hold this person, inside the industry and adjacent to it. Competitors, upstream and downstream operators, and the non-obvious employers where the same work happens under a different banner. The landscape is the spine of the search, not the limit of it.
Draw the Title Boundary
Titles are unreliable. The same work carries different names across industries, and the ideal candidate frequently sits under a title nobody would have searched for. Adjacent and equivalent titles are mapped deliberately, which is where a meaningful share of every pool comes from.
Build the Range, Ideal to Floor
The pool is not a list of perfect matches. It runs from the ideal profile down to the documented minimum viable acceptable criteria, so the client can see the whole distribution and make a decision against it rather than against whoever answered first.
Engage the Whole Map
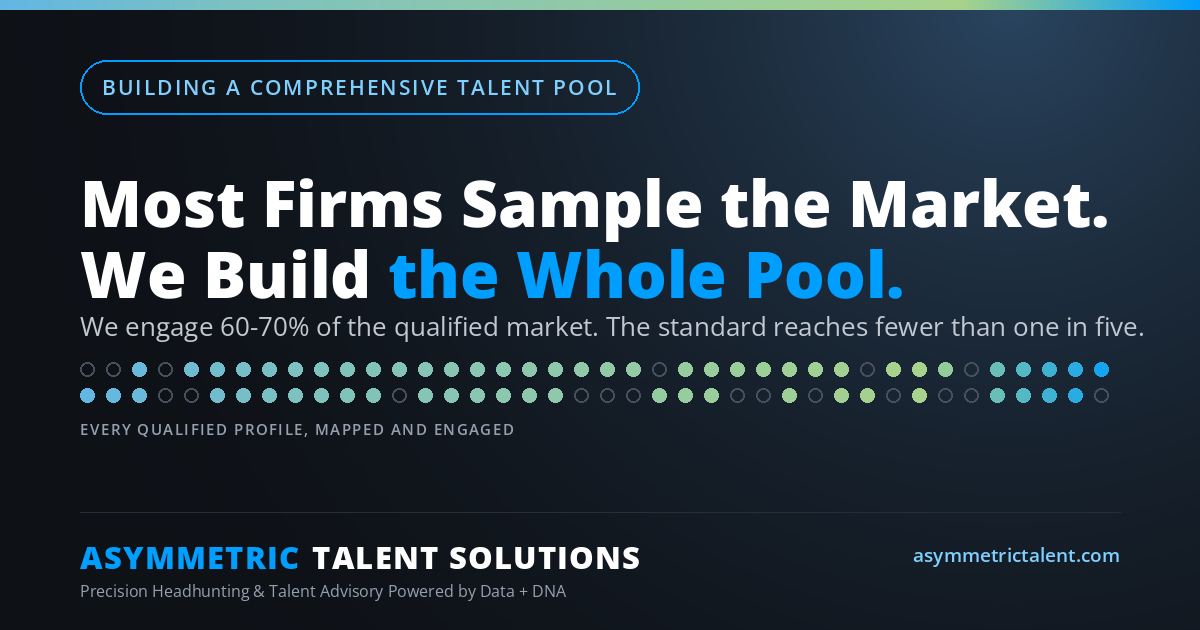
Multichannel, position-specific outreach against the entire qualified pool. Average market penetration runs 60 to 70 percent. The commitment is to work the full pool, not a convenient sample of it. Volume is not the point. Reaching the people who would never answer a job post is the point.
Report the Whole Map
The client sees the talent map, live, in the portal: who is in scope, who has been engaged, who responded, who passed, and why. Weekly steering calls run against that data. You are not shown finalists. You are shown the market and where your finalists sit inside it.
Eight gates, in order. The boundary is drawn before anyone is contacted.
This is the architecture, not a single engagement funnel. The first four gates are construction, and they finish before outreach begins. The last four are qualification, and they run in the open where the client can audit them. Values shown are firm-wide standards, not one search’s record.
Why the Long List Is Not Capped
A fixed finalist count is a convenience for the search firm, not a discipline for the client. If seven qualified, interested, assessed candidates exist, the client sees seven. If it is three, it is three. The number is an output of the market, not a target set in advance.
Five out of six hundred is a fact. Five out of nothing is a hope.
Full-pool engagement produces intelligence a sample cannot.
Working the entire mapped pool means the people who pass are also data. Every non-progression is captured with a documented reason and reported to the client during the search, not after it. The categories below are the intelligence layer ATS tracks on every committed search. Counts are engagement-specific and appear in the client portal, not in a methodology piece.
| Compensation and Package | Steers pricing |
| Work Requirements (on-site, travel, schedule, on-call) | Steers the brief |
| Career Alignment and Scope | Steers the brief |
| Timing (mid-cycle elsewhere, recent move) | Steers sequencing |
| Employer Brand and Culture Perception | Steers the EVP |
| Geography and Relocation | Steers scope |
| Counteroffer and Retention | Steers the close |
| Disqualified Post-Screen | Steers criteria |
A sample cannot produce a pattern. When a firm speaks to 15 or 20 percent of a market, the reasons people passed are anecdotes. When the engaged share runs 60 to 70 percent, the same reasons become a distribution, and a distribution can steer a search.
This is where a brief gets corrected mid-flight instead of after a failed close. If compensation objections concentrate at a specific band, the pricing is wrong and you learn it in week three. If declines cluster on employer brand, that is a finding about the company, not about the search. If nobody declines on comp, the role is priced correctly and the budget conversation never needs to happen.
None of that is available to a process that only talked to the people who were already interested.
Boundary drawn in week one. Finalists in three to four weeks.
Front-loading the map does not slow the search. It is the reason the search moves. The client invests less than four hours across the engagement, because the work happens in the portal and the client engages with it on their own schedule rather than sitting in screening calls.
Discovery
The seat is defined. Ideal profile and minimum viable acceptable criteria documented and signed off. Compensation position established from primary research.
Architecture
Company boundary and title boundary drawn. The qualified pool is built and counted, averaging ~600 profiles. The map goes live in the client portal.
Engagement
Multichannel outreach against the full pool. Penetration tracked live. Decline reasons and compensation signals captured and reported at the weekly steering call.
QIA Long List
Qualified, interested, and assessed candidates assembled with complete case files. Uncapped. The market sets the number, not a template.
Down-Select and Close
The client selects who advances against uniform evidence. Offer, close, and the post-search re-map that verifies the original boundary was complete.
Performance against the standard, not against the average.
ATS figures are firm-wide averages drawn from completed engagements. Industry figures in the right-hand column are drawn from AESC, SHRM, and adjacent talent acquisition research.
| Metric | Asymmetric Talent | Industry Average |
|---|---|---|
| Market Penetration | 60 to 70% | 15 to 20% (AESC, SHRM) |
| Time to Finalists | 3 to 4 weeks | 8 to 16 weeks (AESC, SHRM) |
| Client Hours Invested | Less than 4 hours | 15 to 25+ hours (AESC, SHRM) |
| Search Completion Rate | 100% on every committed search | 15 to 20% contingent fill rate (AESC, SHRM) |
| Candidate Response Rate | 3x | Baseline |
| Qualified Talent Delivered | 5x more | Baseline |
| Talent Pool Depth | ~600 profiles per search | No published benchmark |
The last row is the argument. There is no published industry benchmark for talent pool depth because the number is not tracked, and it is not tracked because the pool is not built. You cannot report the size of a thing you never drew a boundary around.
Every completed search is re-mapped. The variance is the receipt.
Claiming full-market coverage is easy. Proving it is a different exercise. After a search closes, ATS rebuilds the map from scratch and compares it against the original. The gap between the two is the honest measure of whether the first pass actually found the market or just found enough of it to finish.
The average variance is 1 percent. That number is the difference between a firm that says it mapped the market and a firm that can show you what it would have missed.
The map does not expire when the search closes. The qualified pool stays live as an asset for the client’s next requisition in the same specialty, including the candidates who were strong and unavailable at the time. The next search does not start at zero. It starts at the boundary you already paid to have drawn.
They will tell you a smaller pool is fine. Sometimes it is.
Nobody asks a search firm for the boundaries of their market, because nobody has ever been offered them. Most of our competition cannot hold the idea in their head. Ask for the map and you will get candidates, because candidates are the only artifact the process produces.
They will tell you a smaller pool is fine because it still produces a good hire. Sometimes it does. Convenience sourcing lands a good candidate often enough to keep the model alive. It just never produces the one thing you actually need: the ability to say your decision was made against everyone, and to prove it.
That is the whole difference. Not a better candidate. A decision you can defend, to a board, to a family, to your next CFO, with the market drawn and the receipts attached.
Traditional recruiting is a leap of faith. We are a paper trail.
Want to see the boundaries of the market for your seat?
Every committed search starts with the map, and the map lives in a portal you can audit in real time. Three ways to begin.